Forex Currency Pair Correlation: How to Reduce Overlapping Position Risk
When you hold several currency pairs at once, are you unsure whether your risk is really spread out?
In short, holding strongly correlated pairs in the same direction tends to turn them into one large position in effect.
This article covers how to read correlation coefficients, an example of overlapping risk, how to count USD exposure and how to adjust your lot size.
Key takeaways
- A correlation coefficient shows how closely two currency pairs move together on a scale of −1 to +1, and the figure is only a guide.
- Even with a 2% acceptable loss, two highly correlated pairs held in the same direction can approach a loss of about 4% at most.
- Count highly correlated pairs as one position and lower the lot size so they share the acceptable loss.
In short: strongly correlated pairs in the same direction stack up losses
- A correlation coefficient shows how closely prices move together, on a scale of −1 to +1
- Some pairs, such as EURUSD and GBPUSD, tend to move in the same direction
- Even with a 2% acceptable loss, two highly correlated pairs held in the same direction can approach about 4% at most
- Correlation changes over time, so use the numbers as a guide
What is a correlation coefficient: the meaning of +1 to −1
A correlation coefficient shows, on a scale of −1 to +1, how much two price movements move in the same direction. For currency pairs, it is calculated from price movements over a set period.
| Correlation coefficient | Meaning | Effect on positions |
|---|---|---|
| Close to +1 | Tends to move in the same direction | Holding both in the same direction stacks gains and losses |
| Close to 0 | Barely moves together | Diversification is more likely to work |
| Close to −1 | Tends to move in opposite directions | Holding both in the same direction tends to offset |
+1 and −1 are theoretical extremes, and real currency pairs rarely reach them exactly. Even for the same pair of pairs, a different period gives a different number.
Examples of strongly correlated combinations
| Combination | Tendency | If you hold both |
|---|---|---|
| EURUSD and GBPUSD | Tend to move in the same direction | Same direction stacks gains and losses |
| EURUSD and AUDUSD | Tend to move in the same direction | Same direction stacks gains and losses |
| EURUSD and USDCHF | Tend to move in opposite directions | Same direction tends to offset |
EURUSD and USDCHF tend to move in opposite directions. So a EURUSD buy and a USDCHF sell are effectively positions in the same direction.
All of these include USD, and a common cause is often the strength or weakness of the USD.
How overlapping positions increase losses
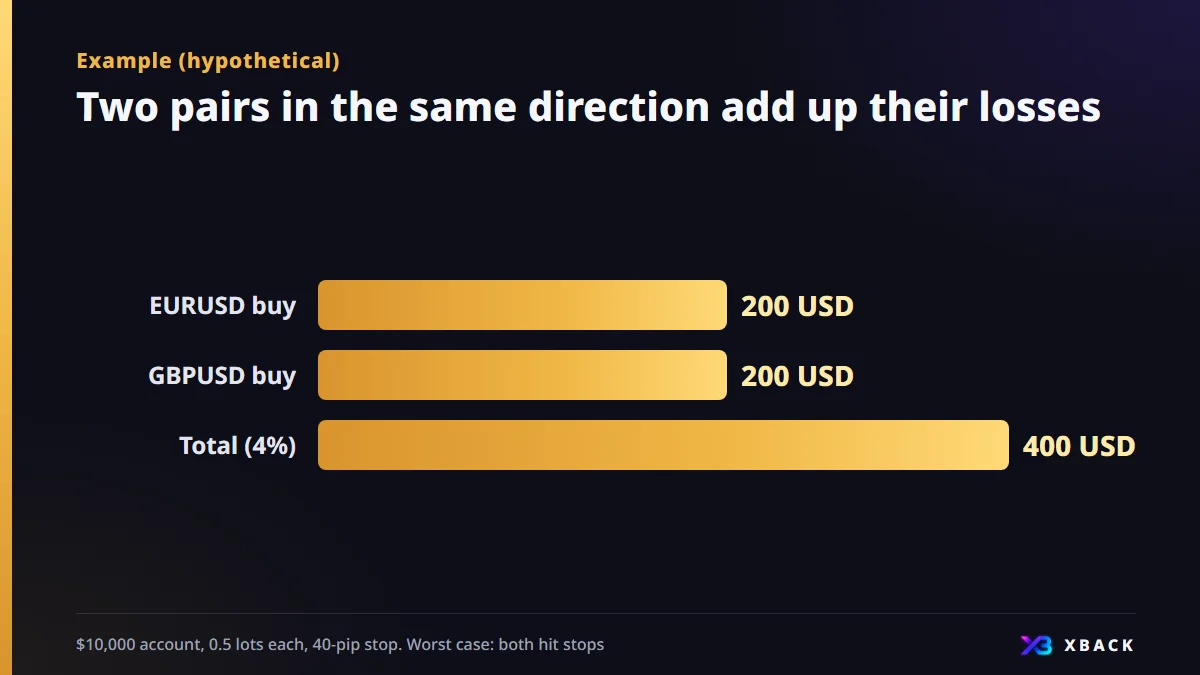
Even if you cap a single loss at 2% of your funds, holding two highly correlated pairs in the same direction can approach a loss of about 4% at most.
- 1
Set the assumptions
Account funds are $10,000 and the acceptable loss per trade is 2% (200 USD).
- 2
Buy EURUSD
With 0.5 lots and a 40-pip stop, 1 pip is 5 USD, so 40 × 5 = 200 USD.
- 3
Buy GBPUSD as well
With 0.5 lots and a 40-pip stop in the same way, the loss is 200 USD.
- 4
Both hit their stops
200 + 200 = 400 USD, which is 4% of $10,000.
Even with two positions, if the price movements line up, it comes close to staking 4% on a single trade.
How to count USD exposure
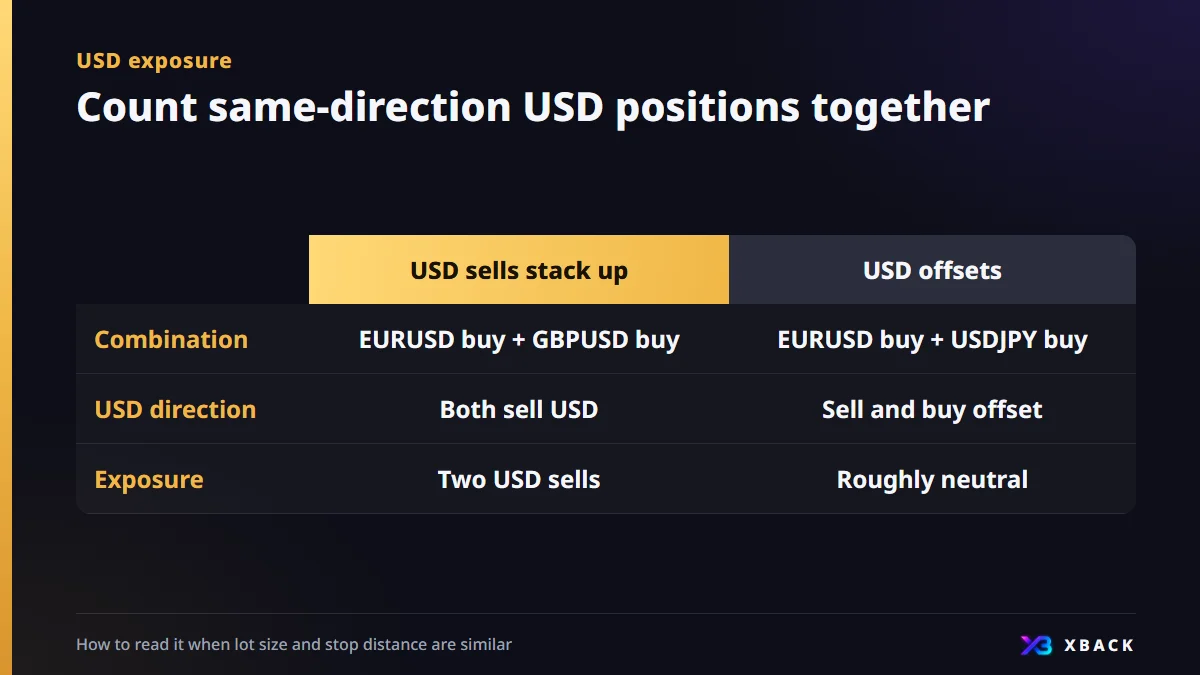
When you hold several pairs, count by which currency you are buying and which you are selling, not by pair name. If many of your pairs include USD, check the direction of USD first.
| Open position | USD direction |
|---|---|
| EURUSD buy | Selling USD |
| GBPUSD buy | Selling USD |
| USDJPY buy | Buying USD |
| USDJPY sell | Selling USD |
| USDCHF buy | Buying USD |
- EURUSD buy + GBPUSD buy: both sell USD, so you have two USD sells
- EURUSD buy + USDJPY buy: the sell and the buy offset, leaving you roughly neutral
- The more your USD sells are lopsided, the more losses show up at once when USD rises
Correlation changes over time and breaks down around releases
- A correlation from a few months ago does not necessarily continue now
- Around indicator releases or statements by key officials, only one of the pairs may move sharply
- When differences in monetary policy between countries stand out, the usual link weakens
- In sudden moves, many pairs can also move in the same direction at once
Correlation changes without notice
Correlation is a statistic from past price movements, not a promise about the future. Use the numbers as a guide for deciding whether to reduce your positions.
Points to watch around indicator releases are also covered in another column. Before a release, deciding not to stack positions can also work.
How to check currency pair correlation
You can start checking without any difficult calculation. Begin by looking with your eyes, and back it up with an external correlation table if needed.
- 1
Line up the charts
Open several charts on the same timeframe and compare the price movements.
- 2
Compare peaks and troughs
See whether the timing of highs and lows lines up.
- 3
Back it up with a correlation table
Check the figures on an external site that publishes a correlation table.
- 4
Look at different periods
Check that the numbers do not differ greatly between a short period and a long one.
Steps to adjust position size for correlation
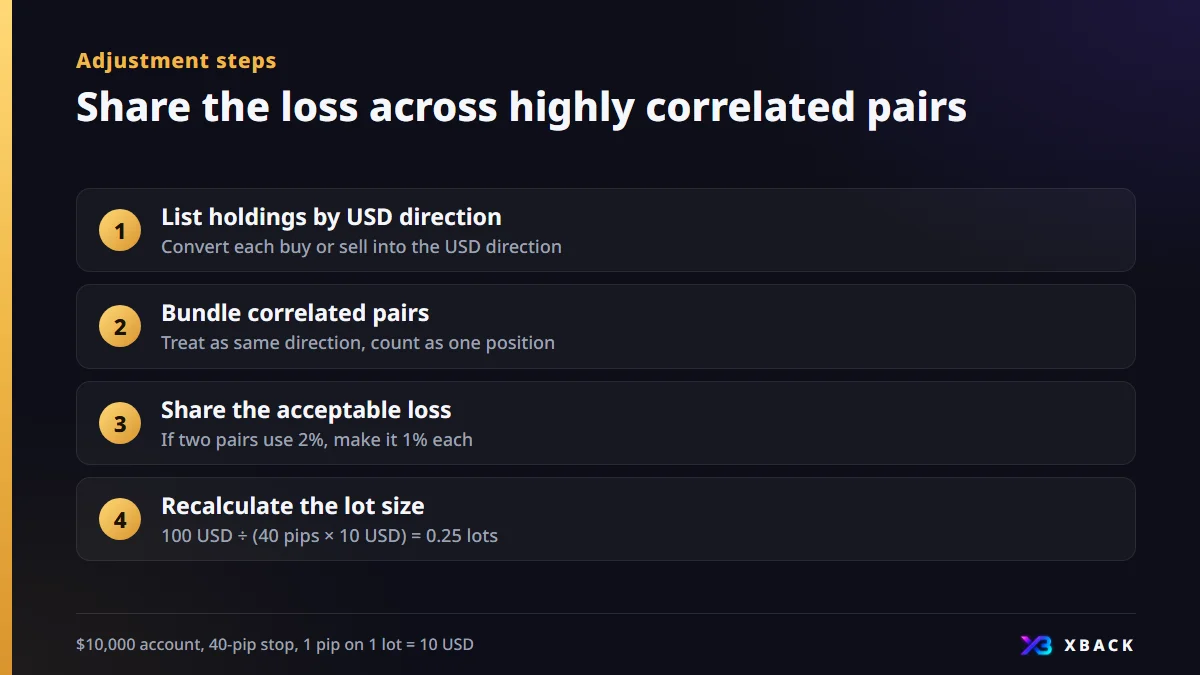
The idea is to count several highly correlated pairs together as one position. Lower the lot size so that they share the acceptable loss.
- 1
Write out your holdings by USD direction
Convert each buy or sell into the direction of USD and line them up.
- 2
Bundle highly correlated pairs
Treat them as the same direction and count them as one large position.
- 3
Share the acceptable loss
If two pairs use 2% in total, make it 1% per pair.
- 4
Recalculate the lot size
100 USD ÷ (40 pips × 10 USD) = 0.25 lots
| Item | Before adjusting | After adjusting |
|---|---|---|
| Lot size per pair | 0.5 lots | 0.25 lots |
| Maximum loss per pair | 200 USD | 100 USD |
| Total for both pairs | 400 USD (4%) | 200 USD (2%) |
You can check the lot calculation with the lot calculator tool. Skipping one of the pairs is also a valid option.
How correlation relates to cashback
Many cashback systems calculate returns from your trading volume. The more positions you open, the more eligible volume you have, but the conditions differ by broker.
Return amounts are not yet confirmed, and we will post them on each broker's page at launch. Avoid stacking positions in the same direction on strongly correlated pairs because of returns.
Enter your funds, stop distance and acceptable loss to calculate the lot size per pair. For highly correlated pairs, calculate using the shared loss.
Use the lot calculatorFAQ
Q.What is currency pair correlation in forex?
It shows how closely the price movements of two currency pairs move in the same direction. It is expressed as a correlation coefficient from −1 to +1. The closer to +1, the more they tend to move in the same direction, and the closer to −1, the more in opposite directions.
Q.Is it forbidden to hold highly correlated pairs at the same time?
It is not forbidden. However, holding them in the same direction stacks gains and losses, so the common approach is to adjust lot size so the total risk fits within the acceptable loss for one trade.
Q.Is the correlation coefficient always the same value?
No. The value changes with the period and timeframe used to calculate it, and it can also break down around differences in monetary policy or indicator releases. Check several periods and use it as a guide.
Q.If a pair does not include USD, do I not need to worry about correlation?
You do. Pairs that do not include USD, such as EURGBP, also have correlations. Counting exposure by which currency you are buying and which you are selling works for any pair.

This article is for information purposes only and is not investment advice. Conditions may change, so please check each broker's official page for the latest information. Offshore FX and CFD trading carries a risk of losses exceeding your principal.