MT5 Backtesting: How to Use and Read the Strategy Tester
Do you want to backtest in MT5 but feel lost among all the settings?
In short, bring the conditions close to real trading and read the results using several numbers.
This article covers how to open the Strategy Tester, differences between models, how to read results, pitfalls and the steps up to a forward test.
Key takeaways
- Backtest in the MT5 Strategy Tester, bringing the conditions close to real trading and reading the results as numbers.
- Read results using total net profit, profit factor, maximum drawdown, number of trades and expected payoff together.
- Watch for overfitting and spread settings, and run a demo forward test before going live.
In short: match the conditions and read the numbers
- A backtest is a way to test a method or EA on past data
- Open the Strategy Tester from the View menu or with Ctrl+R
- Models trade accuracy for speed, so use them in stages
- Even with good results, run a forward test on a demo account before going live
What is a backtest? Purpose and limits
A backtest runs your rules on past market data to check how they perform. You can learn the quirks of a method or EA without using real funds.
- You can confirm that the rules run as you intended
- Numbers such as maximum drawdown show how large the losses can get
- You can compare the effect of changing lot size under the same conditions
- You can rule out settings that clearly do not fit before live trading
However, winning in the past is no guarantee of winning in the future. It is safer to think of a backtest as a tool for finding failures, not proof that something passes.
How to open the Strategy Tester and the settings
In MT5, choose Strategy Tester from the View menu or press Ctrl+R to open it. Then decide the following items in order. The focus of testing is the EA (automated trading).
| Item | Content | Guide for choosing |
|---|---|---|
| Expert | The EA to test | Choose the EA you want to test |
| Symbol | The currency pair or other instrument to test | Match the symbol you actually trade |
| Timeframe | The chart timeframe used for testing | Match the timeframe the EA expects |
| Date | The range of dates to test | Make it long enough to include rising, falling and ranging markets |
| Model | How price movement is reproduced | Differences are compared in the next section |
| Initial deposit | Funds at the start of the test | Bring it close to the amount you will use (e.g. $1,000) |
| Leverage | The ratio used in the test | Match your actual account setting |
Differences between models: accuracy versus speed
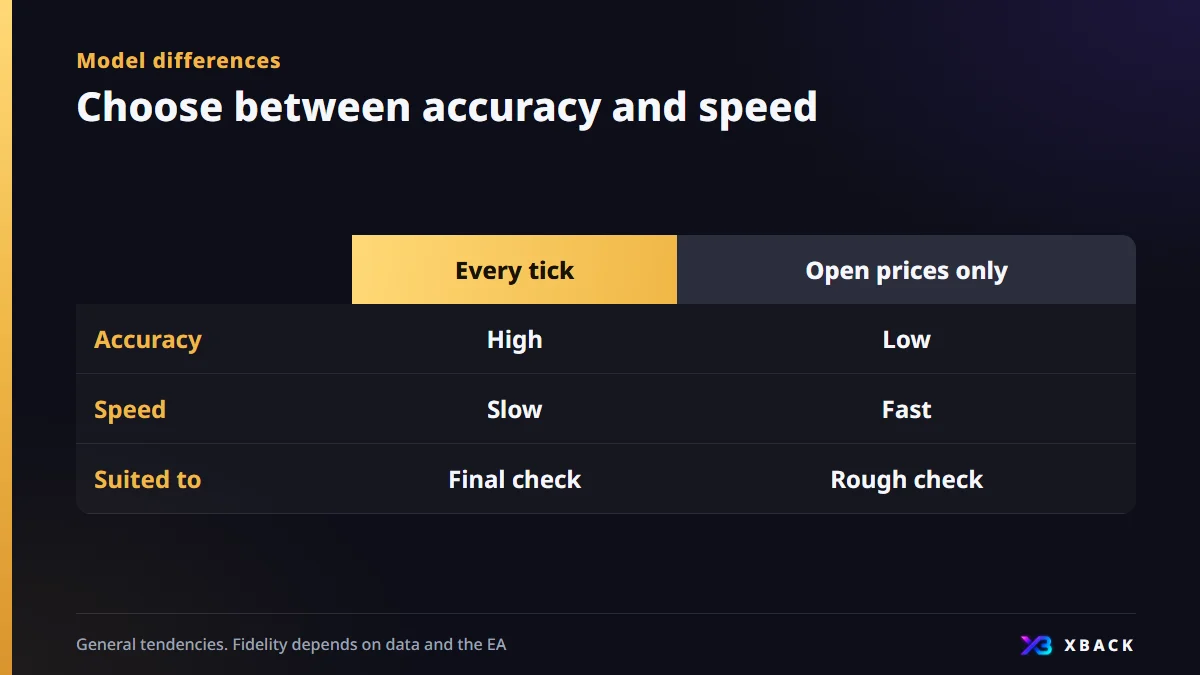
The model is the setting that decides how finely past price movement is reproduced. The finer it is, the closer to reality, but the longer it takes.
| Model | Accuracy | Speed | Suited to |
|---|---|---|---|
| Every tick | High | Slow | Final check |
| 1 minute OHLC | Medium | Medium | Methods working on a scale of hours |
| Open prices only | Low | Fast | Rough check |
Open prices only suits an EA that acts only when a bar is confirmed. An EA that trades often in the short term gives results that drift unless you use Every tick. You can save time by narrowing down with a fast model first, then testing only the promising ones in detail.
How to read results: combine five numbers
When the test finishes, results such as total net profit and number of trades appear. Do not judge by one number alone. Look at several as a set.
| Metric | Meaning | Guide for reading |
|---|---|---|
| Total net profit | The sum of profit and loss on all trades | Even if positive, read it with the other numbers |
| Profit factor | Gross profit ÷ gross loss | Above 1 means profit exceeds loss |
| Maximum drawdown | The largest drop in equity | Check whether it is an amount you can tolerate |
| Number of trades | Trades made during the test | If low, the result is more likely due to chance |
| Expected payoff | Average profit or loss per trade | Check that it is positive after costs |
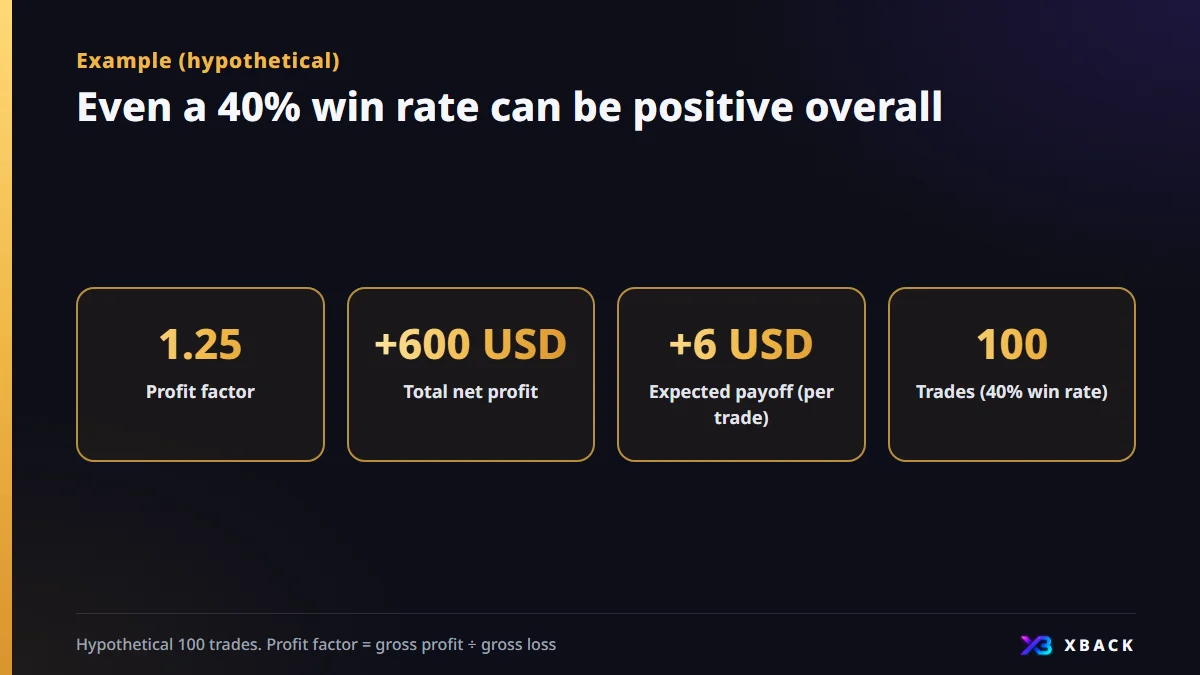
Suppose the following results appear. All figures are a calculation example.
- 100 trades, 40 wins and 60 losses (win rate 40%)
- Gross profit is 3,000 USD (an average of 75 USD per win)
- Gross loss is 2,400 USD (an average of 40 USD per loss)
- Total net profit is 3,000 − 2,400 = +600 USD
- Profit factor is 3,000 ÷ 2,400 = 1.25
- Expected payoff is 600 ÷ 100 = +6 USD per trade
Even with a 40% win rate, results can be positive if wins are large. Win rate alone does not decide whether something is good. Always check whether you can tolerate the maximum drawdown.
4 common pitfalls in backtesting
Overfitting (curve fitting)
If you fine-tune settings to fit past data, they end up fitting only that period. This is called overfitting, and results tend to fall apart in future markets. The fix is to check results on a period you did not use for tuning.
A spread setting that differs from reality
If the tester's spread is narrower than the real one, results look better than they really are. Check the spread in normal and widened conditions, and test with a slightly wider one for a safer estimate. Spreads differ by broker, so check the official page.
Overlooking commissions and swaps
Depending on the account type, trading commissions may apply. For an EA that holds positions overnight, swaps also affect profit and loss. Check whether they are included in the results, and subtract them yourself if they are not.
Data quality and execution differences
The price data used in a test differs in quality by source and period. Including a period with gaps can distort results. In real trading, slippage is added as well.
Steps up to a forward test
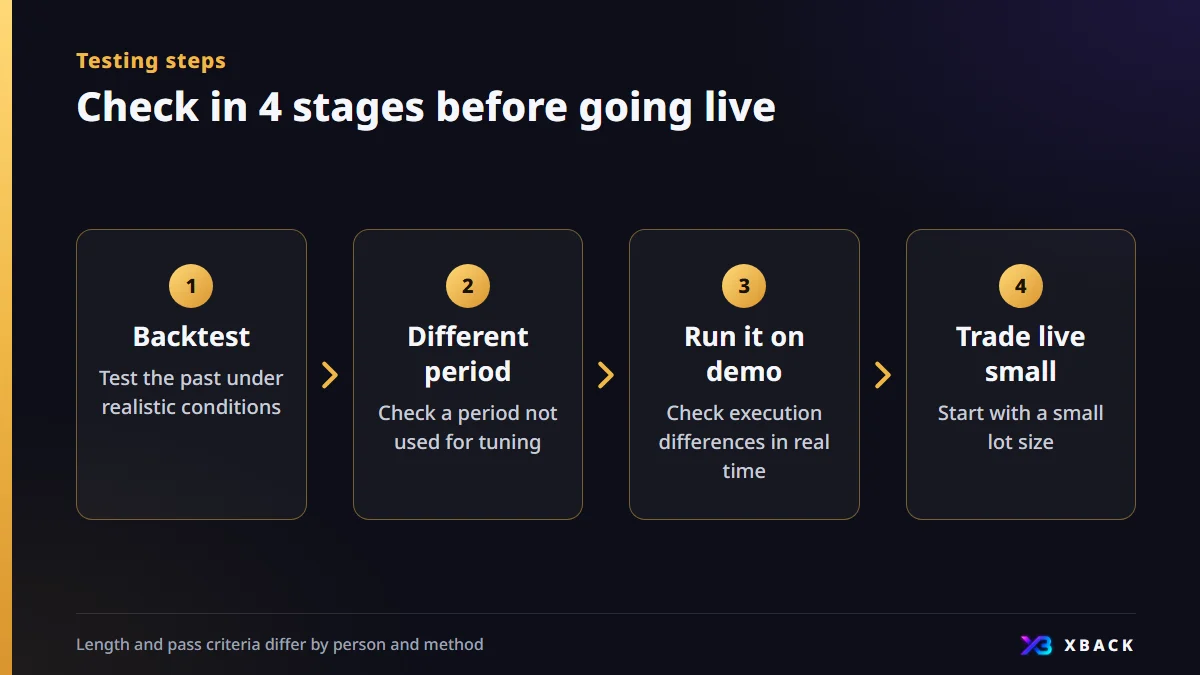
A forward test checks a method while real time moves forward, such as on a demo account. It lets you check execution differences and problems in the operating environment that a backtest cannot show. Start by writing out your pass criteria.
- 1
Backtest
Test the past under conditions close to reality. Bring the spread and funds close to live trading too.
- 2
Check on a different period
Look at results on a period you did not use for tuning. If it falls apart here, suspect overfitting.
- 3
Run it on demo
Check execution differences in real time. There is no fixed length, and including several market phases gives more confidence.
- 4
Trade live with a small amount
Start with a small lot size. Keep a trading journal and judge whether it meets your criteria.
Cashback is not in the results report
A backtest results report does not include cashback. If you want to factor in returns, calculate them separately from trading volume. Return amounts are not yet confirmed, and we will post them on each broker's page at launch.
- Calculate the expected return as a separate line from total net profit
- Do not pick an EA with poor results because of returns
- The more trades a method makes, the larger the effect of returns tends to be
- Whether or not there are returns, first check that profit and loss is positive
Enter your win rate and average profit and loss to calculate expectancy per trade. Compare it with your backtest results.
Check with the expectancy toolFAQ
Q.Will an EA that wins in a backtest also win in live trading?
There is no guarantee. Overfitting to past data and spreads that differ from reality can lower results in live trading. Check on a different period and run a forward test on a demo account in between.
Q.Which model should I choose?
Every tick is the usual choice for the final check. Another way is to narrow down roughly with a fast model such as Open prices only first, then test only the promising ones in detail. Open prices only suits an EA that acts only when a bar is confirmed.
Q.What profit factor is good enough?
There is no fixed standard. Above 1, profit exceeds loss, but with few trades it may be chance. Judge together with maximum drawdown, expected payoff and costs.
Q.How long should I run a forward test?
There is no fixed length. To include several market phases, many people run it for a few weeks to a few months. Focus less on the length and more on whether it meets the pass criteria you set in advance.

This article is for information purposes only and is not investment advice. Conditions may change, so please check each broker's official page for the latest information. Offshore FX and CFD trading carries a risk of losses exceeding your principal.